Please log in to read this in our online viewer!

Please log in to read this in our online viewer!
No comments yet. You can be the first!
What did others read after this?
Content extract
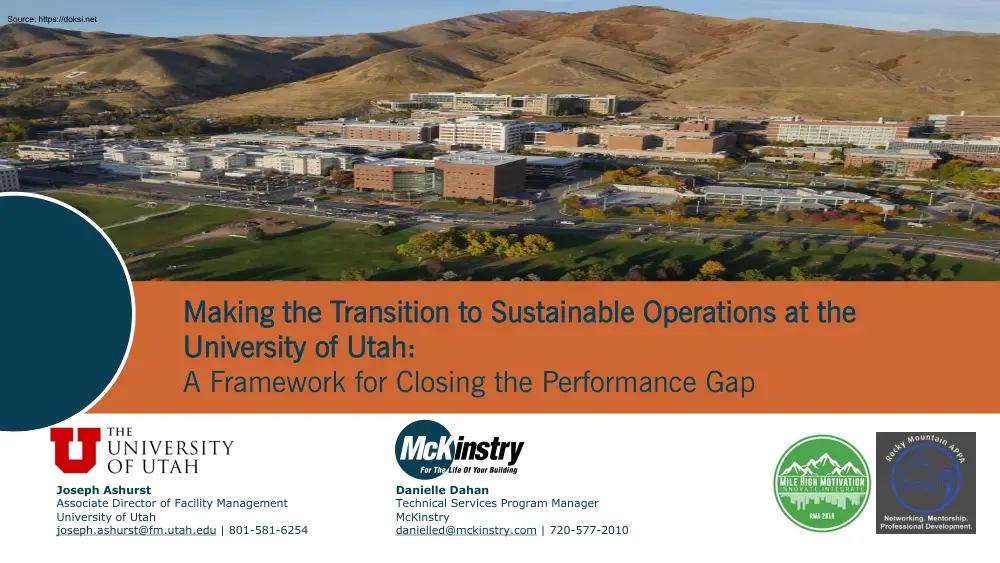
Making the Transition to Sustainable Operations at the University of Utah: A Framework for Closing the Performance Gap Joseph Ashurst Associate Director of Facility Management University of Utah joseph.ashurst@fmutahedu | 801-581-6254 Danielle Dahan Technical Services Program Manager McKinstry danielled@mckinstry.com | 720-577-2010 Learning Objectives Identify existing gaps in the transition of your buildings & utilize industry best practices to build new procedures and processes. These often include the development of an asset management system, a warranty management system and standard operating procedures. Leverage fault detection and diagnostics tools to continually monitor new or retrofitted equipment. Develop and define Key Performance Indicators (KPIs) early in the design process to track the critical components of a successful transition. A Framework for Closing the Performance Gap The Performance Gap • High Performance, Sustainable Design buildings
often do not perform as designed • 50% of energy is wasted in buildings • Operators and technicians are not provided with the right tools to manage new, complex controls systems The Performance Gap University of Utah by the Numbers 32,760 Total University Enrollment >500 Buildings 15MM Square Feet 1,535 Acres of University-Owned Land 3 High-Temperature, Hot Water Plants 5 Chilled Water Plants University of Utah Health Sciences • Only university health care system in the state of Utah • Training ground for Utah health care professionals • 14,000 faculty & staff • 4 million sqft; 23 buildings University of Utah Health Sciences Campus 1 Health Sciences Academic & Research Buildings 1.7M sqft 2 University Hospital Campus 1.3M sqft 3 Huntsman Cancer Institute & Hospital 1M sqft The Need The U needed help addressing four major deficiency areas with the campus: 1. Capacity Issues 2. Lack of Redundancy 3. Aging Equipment 4. Lack of
Automation Building a Central Plant vs Optimizing Portfolio First Cost $50,000,000 $40,000,000 $30,000,000 40-yr NPV $39,300,000 $30,384,000 $30,000,000 $20,000,000 $10,000,000 $$(10,000,000) $(20,000,000) $(30,000,000) $(40,000,000) $(40,000,000) $(50,000,000) Central Plant Addition Conservation Measures Energy Efficiency Improvement Needs Recover plant capacity through efficiency & load reduction Cost & Schedule Strategies $ Future Growth of HSC No Impact to Operations N+1 Redundancy Campus Energy Efficiency Project (CEEP) Rehab ~310 tons ACC ~590 tons 04/2021 10/2020 4/2020 10/2019 4/2019 10/2018 4/2018 10/2021 New School of Medicine ~730 ton Plant Peaks w/1600 Ton Addition 10/2017 04/2017 Huntsman IV, ~700 tons Possible Expedited SOM Vacation and Utility Shutdown Old School of Medicine ~1,800 ton Conservation Strategies 400 to 600 Ton Load Reduction w/ Evaporative Cooling on Lab AHUs w/ 100% OA 200-300 Ton Load Reduction w/Lab Fume
Hood VAV Retrofit w/Occupancy Sensor • Utilize critical space controls and venturi air valves • Occupancy sensors in building zones • Targeted lighting retrofit 700 to 1100 Ton Capacity Increase on Central Plant • Increase CHWST from 39F to 42F w/elimination of building-level HX • Coil level independent flow control valve retrofit for better control and better delta T • Increase CWST to increase chiller capacity Opportunities to Fill Gaps & Optimize Transition Issue Management Services Building Performance Optimization Maintenance Planning & Management Facility Consulting Services Facility Management Services ? Remote Monitoring Services Facility Project Management Operations Benchmarking Energy Program Management Transition to Sustainable Operations Program Construction to Operations Active Energy Management Capital Planning TSO at University of Utah Preliminary Investigation Go Live: Present Findings & Kick Off Ongoing Phase Project Kick
Off Q1 Quarterly Review Preliminary Investigation 3/18 5/18 Q2 Quarterly Review Q3 Quarterly Review Ongoing Phase Year 1: Project Development 9/1/18 12/18 Project Completion 3/19 6/19 6/22 Setting Key Performance Indicators (KPIs) • Characteristics of a KPI • Measurable Time component Demonstrate success of the project Allows for further optimization Example KPIs Building energy usage Campus energy usage Cost of corrective maintenance per asset Percent of assets that have warranty information documented KPIs allow us to monitor, analyze, and optimize the performance of the TSO program Identifying Gaps & Opportunities Key Steps in Identifying Gaps • One-on-one conversations with various staff • Data collection & analytics • Site observations & building walkthroughs Asset Management • Asset Tagging • CMMS data • Capital planning tool • Pilot demonstration Operating Procedures •
Developing procedures for maintaining all equipment • • • Standard Operating Procedures (SOPs) Maintenance Operating Procedures (MOPs) Emergency Operating Procedures (EOPs) • Working closely with building maintenance staff to develop procedures • Training staff • Standardized naming & storing of procedures for ease of access Active Energy Management • Fault Detection for identifying energy savings measures • Dashboard for University staff to view measures & building performance • Implementing energy savings measures Overcoming Challenges Many different staff in an organization can have very different views on what the standards should look like Some staff may feel protective of their area of work and be hesitant to outside input Large organizations may have many similar or overlapping initiatives occurring at once Questions? Joseph Ashurst Associate Director of Facility Management University of Utah joseph.ashurst@fmutahedu |
801-581-6254 Danielle Dahan Technical Services Program Manager McKinstry danielled@mckinstry.com | 720-577-2010


